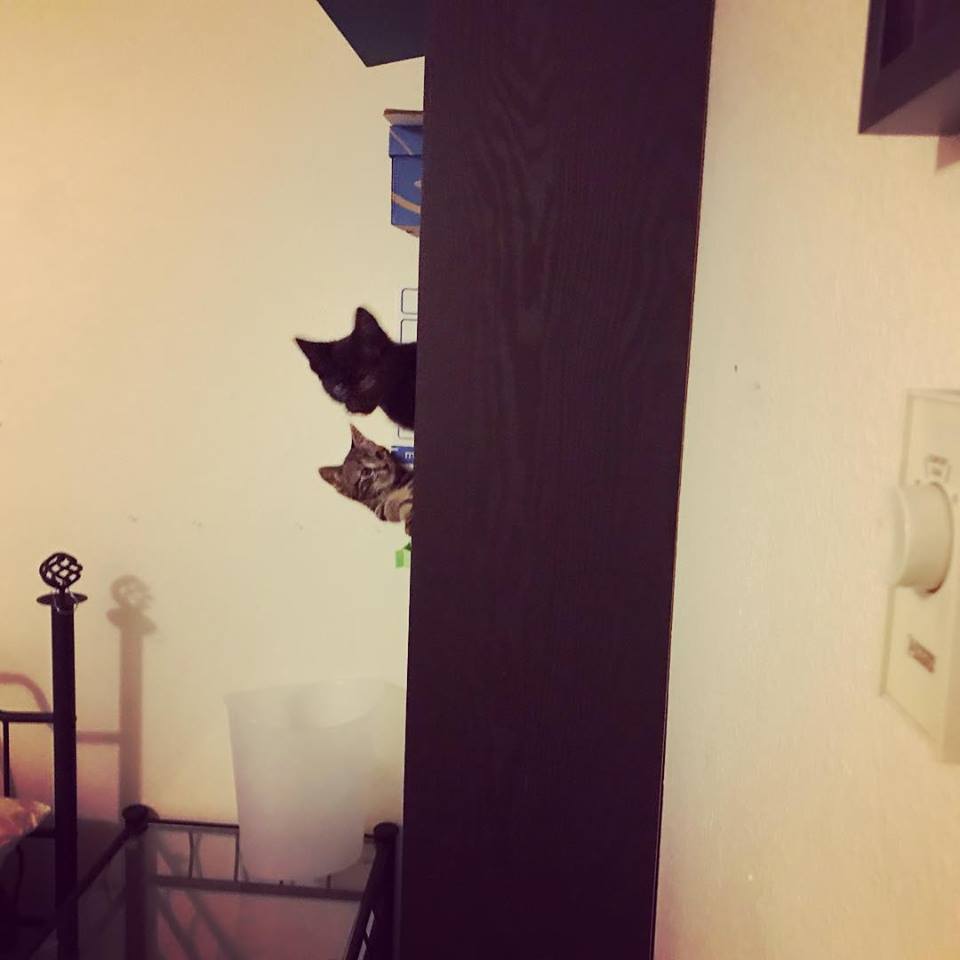
Stormy (top) and Foggy (bottom) are the new feline interns at Mad Scientist Journal. Here they demonstrate their problem solving skills by getting higher up the bookcase than we thought they could.
November was relatively quiet, with most of our effort going towards getting Winter 2018 out the door.
Probably the biggest excitement, which bled over to December, were exceptional problems getting our proof copy of the quarterly. Pro-tip: make sure your zip code on your shipping address is correct.
The Money Aspect
Amounts in parentheses are losses/expenses.
Hosting: (-$17.06)
Stories: (-$100.00)
Art: (-$358.43)
Advertising: (-$80.19)
Processing Fees: (-$9.57)
Donations: $38.71
Ad Revenue: $0.31
Online Book Sales: $84.47
Total: (-$441.76)
QTD: (-$527.80)
YTD: (-$6,121.53)
All Time: (-$25,700.00)
As usual, I try to list costs for art and stories under the month that the stories run on the site rather than when I pay them. (This does not apply to special content for quarterlies, which does not have a specific month associated with it.) Sales are for sales when they take place, not when they’re actually paid out to me. Online book sales reflect the royalties given after the retailer takes their cut. Physical book sales represent gross income, not counting the cost of the physical book. Donations include Patreon as well as other money sent to us outside of standard sales.
Art costs were up a little higher due to paying for cover art. We had no conventions in November, so no physical sales.
Submissions
In November, we were closed to submissions. Our all time acceptance rate remains 38.1%.
Followers
Below is the social media following we had at the end of November.
Patreon: 13 (-2)
Facebook: 1,736 (+27)
Twitter: 567 (+10)
Tumblr: 249 (-17)
Mailing List: 84 (+5)
Google+: 64 (+1)
Traffic
Last Three Months:
November 2017: 1,491 visits, 1,137 users, 2,108 page views, peak day of 121.
October 2017: 1,408 visits, 1,134 users, 2,179 page views, peak day of 107.
September 2017: 1,666 visits, 1,266 users, 2,841 page views, peak day of 135.
Last three Novembers:
November 2016: 959 visits, 701 users, 1,475 pages views, peak day of 69 visits.
November 2015: 576 visits, 427 users, 970 page views, peak day of 45 visits.
November 2014: 946 visits, 600 users, 1,595 page views, peak day of 93 visits
Traffic is up significantly from previous years, especially compared to October. Since we were closed to submissions, that’s particularly surprising. As is typical, StumbleUpon and Facebook are our primary sources of traffic. Since I don’t pay for advertising on StumbleUpon, I’m particularly impressed. I keep thinking I need to advertise more on Twitter, but haven’t yet.
Follow us online: