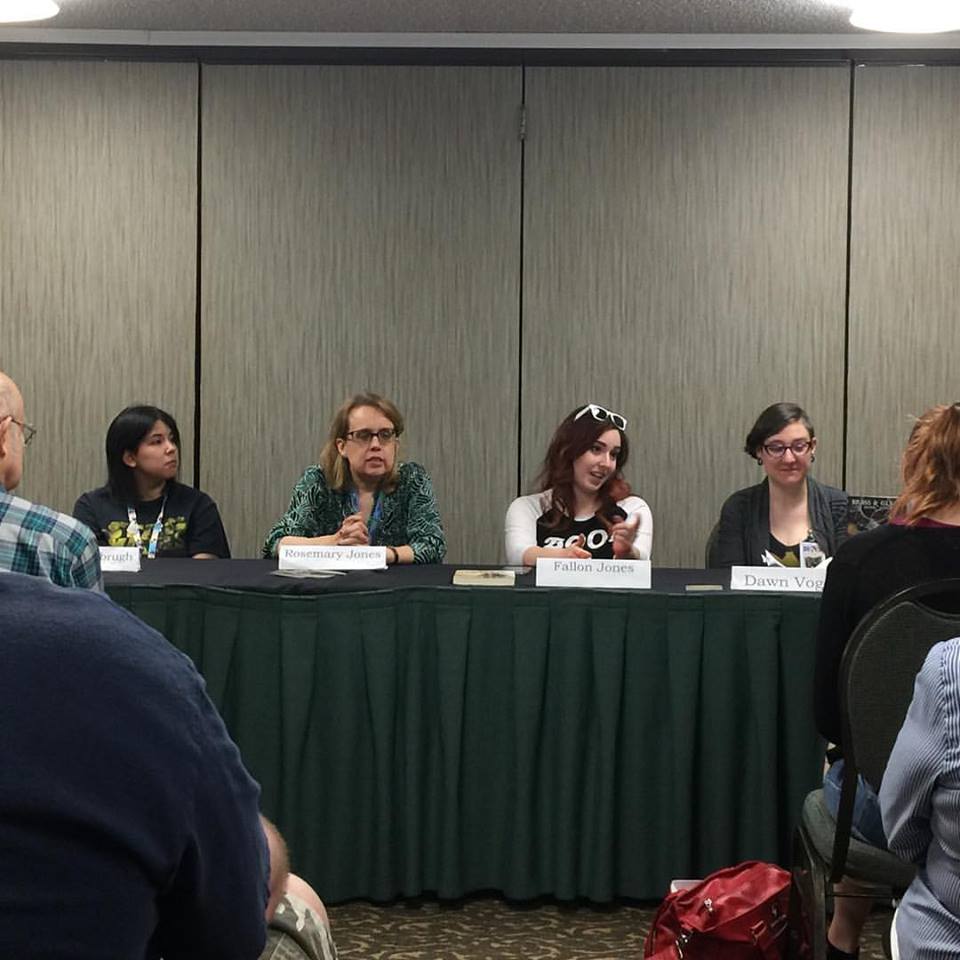
Gothic Literature panel at SpoCon featuring Dawn Vogel with fellow authors Kaye Thornbrugh, Rosemary Jones, and Fallon Jones.
We are winding into the last stretch for getting Utter Fabrication out the door, which means expenses are picking back up. We’ve also been doing some different things with content on the site. How does this all break down numerically? Read on!
The Money Aspect
Amounts in parentheses are losses/expenses.
Hosting: ($17.06)
Stories: ($150.00)
Art: ($687.09)
Advertising: ($94.00)
Processing Fees: ($27.08)
Printing: ($429.45)
Conventions: ($365.00)
Donations: $72.55
Ad Revenue: $0.03
Kickstarter: $6.00
Online Book Sales: $77.59
Total: ($1,613.51)
QTD: ($1,613.51)
YTD: ($2,099.81)
All Time: ($22,120.04)
As usual, I try to list costs for art and stories under the month that the stories run on the site rather than when I pay them. (This does not apply to special content for quarterlies, which does not have a specific month associated with it.) Sales are for sales when they take place, not when they’re actually paid out to me. Online book sales reflect the royalties given after the retailer takes their cut. Physical book sales represent gross income, not counting the cost of the physical book.
I got my months a little mixed up in last month’s post when I said that the final art cost had been paid. June had some of the interior art costs, but July had the rest. Final cover costs will happen in August. The convention cost for July was paying for our table at GeekGirlCon in September.
This month also had a bit more money from the Kickstarter trickle in as one of the previously-rejected pledges corrected things through Backerkit. Sales were also up a bit, especially on Kindle.
I need to look at a different advertising option, or just remove the ads from the site entirely, but I haven’t yet. We’ve seen a strong increase in traffic overall as we’ve added more content the last couple months. But Project Wonderful relies on people bidding. And apparently they aren’t bidding on us. It’s never been a significant revenue generator for us, so I’m not sure if there’s any value in continuing to have advertising on the site at all.
Submissions
We were closed to submissions in July. Our all time acceptance rate remains 38.6%.
Followers
At the end of July, we had:
Facebook: 1,640 (+10)
Twitter: 542 (+7)
Google+: 64 (+1)
Tumblr: 230 (+3)
Mailing List: 76 (+0)
Patreon: 15 (+0)
Traffic
In July, we had 1,216 visits, a slight decrease from previous month. 914 users and 2,210 page views. Our peak day was 120 visits.
Follow us online: