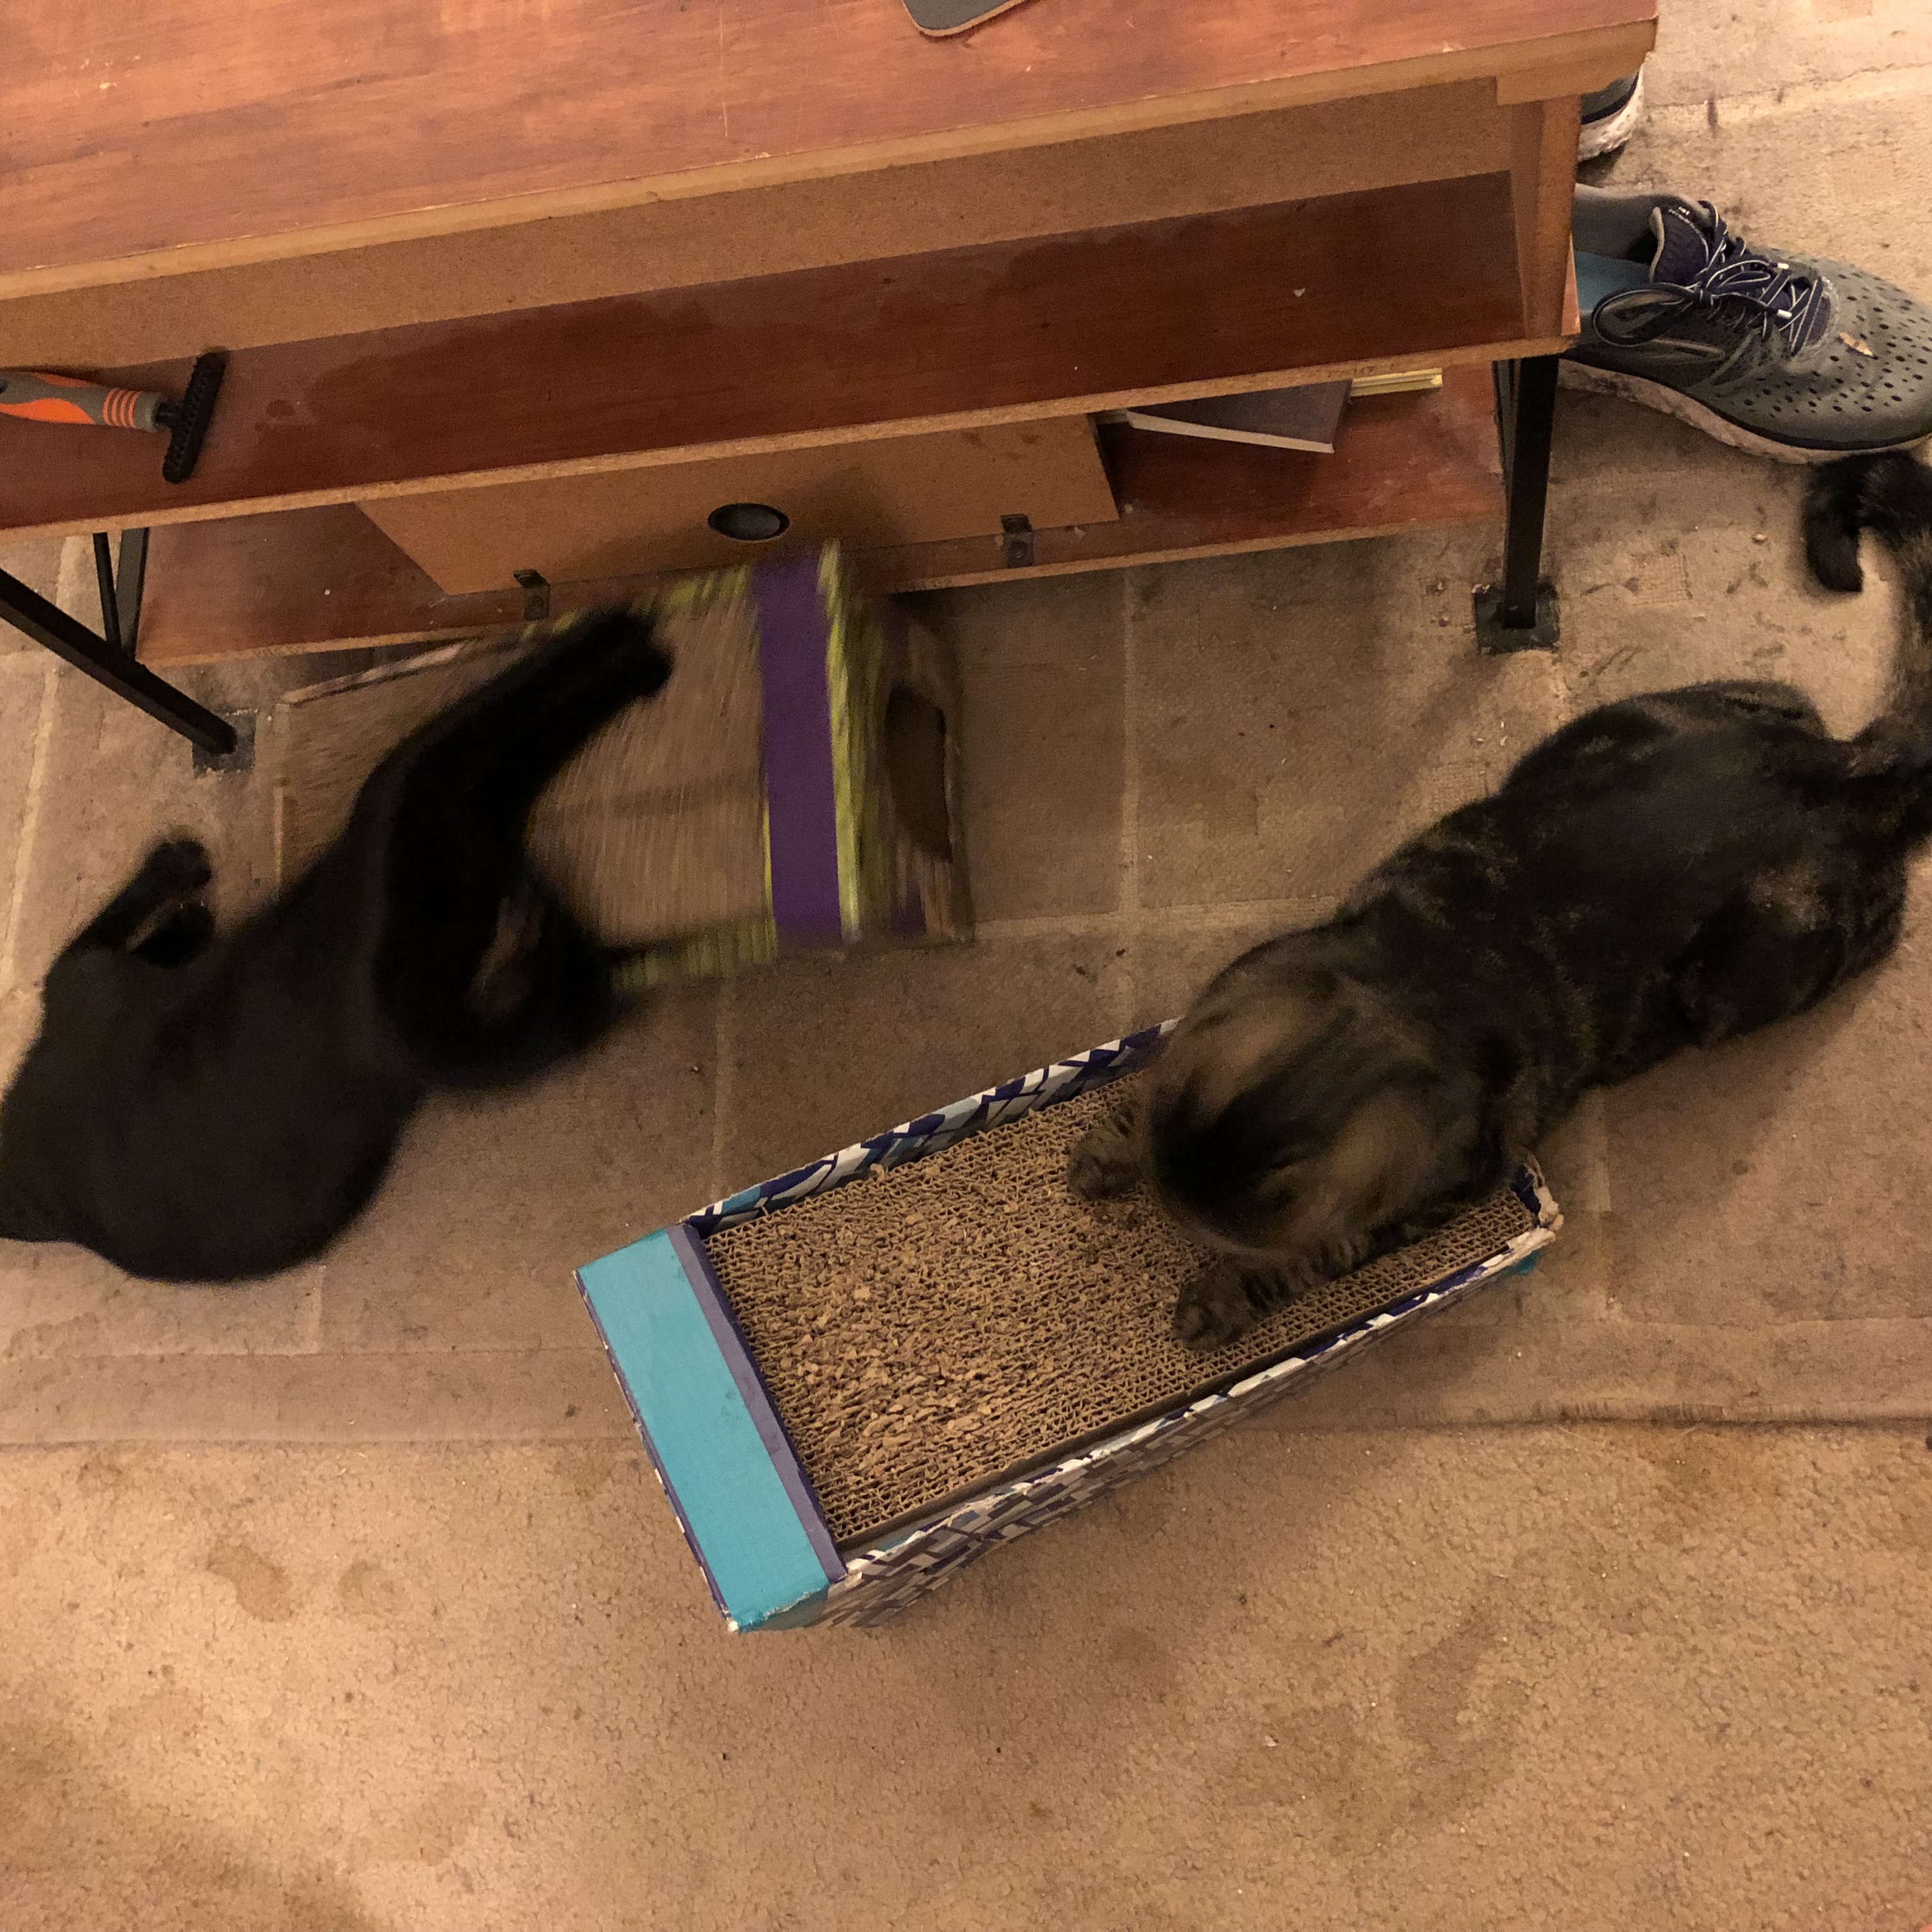
Our feline interns enjoying some catnip.
This month was about final touches on both the Autumn 2019 quarterly and I Didn’t Break the Lamp.
The Money Aspect
Amounts in parentheses are losses/expenses.
Web Resources: (-$17.06)
Stories: (-$380.00)
Art: (-$704.05)
Advertising: (-$184.26)
Processing Fees: (-$10.84)
Printing: (-$7.59)
Conventions: (-$200.00)
Donations: $394.89
Physical Sales: $15.00
Online Book Sales: $22.32
Total: (-$1,071.59)
QTD: (-$4,187.26)
YTD: (-$4,848.07)
All Time: (-$41,031.64)
As usual, I try to list costs for art and stories under the month that the stories run on the site rather than when I pay them. (This does not apply to special content for quarterlies, which does not have a specific month associated with it.) Sales are for sales when they take place, not when they’re actually paid out to me. Online book sales reflect the royalties given after the retailer takes their cut. Physical book sales represent gross income, not counting the cost of the physical book. Donations include Patreon, as well as other money sent to us outside of standard sales.
Some final art costs for I Didn’t Break the Lamp and Autumn 2019 this month. We also got accepted into GeekGirlCon, so we had to pay for our table there.
Submissions
We are closed to submissions. Our final all time acceptance rate is 33.54%.
Followers
Below is the social media following we had at the end of June.
Patreon: 32 (+0)
Facebook: 2,201 (+2)
Twitter: 692 (-4)
Tumblr: 353 (+0)
Mailing List: 280 (-6)
Instagram: 219 (+8)
Traffic
Traffic this month is a little weird because I broke the site a few weeks ago and didn’t fix the Google Analytics plugin when I fixed the rest of it. Unfortunately, I didn’t notice until I started this post. I’ve fixed it now, but over half the month of September has not had any analytics recorded. I don’t know what I’ll do for next month. This part of the report may get dropped for the remaining six months.
Last three months:
August 2019: 775 visits, 531 users, 1,318 page views, peak day 40 visits.
July 2019: 774 visits, 607 users, 1,303 page views, peak day 40 visits.
June 2019: 1,330 visits, 850 users, 2,595 page views, peak day 89 visits.
Last three Augusts:
August 2018: 1,121 visits, 861 users, 1,669 page views, peak day 58 visits.
August 2017: 965 visits, 762 users, 1,581 pages views, peak day of 47 visits.
August 2016: 809 visits, 587 users, 1,318 page views, peak day of 55 visits.