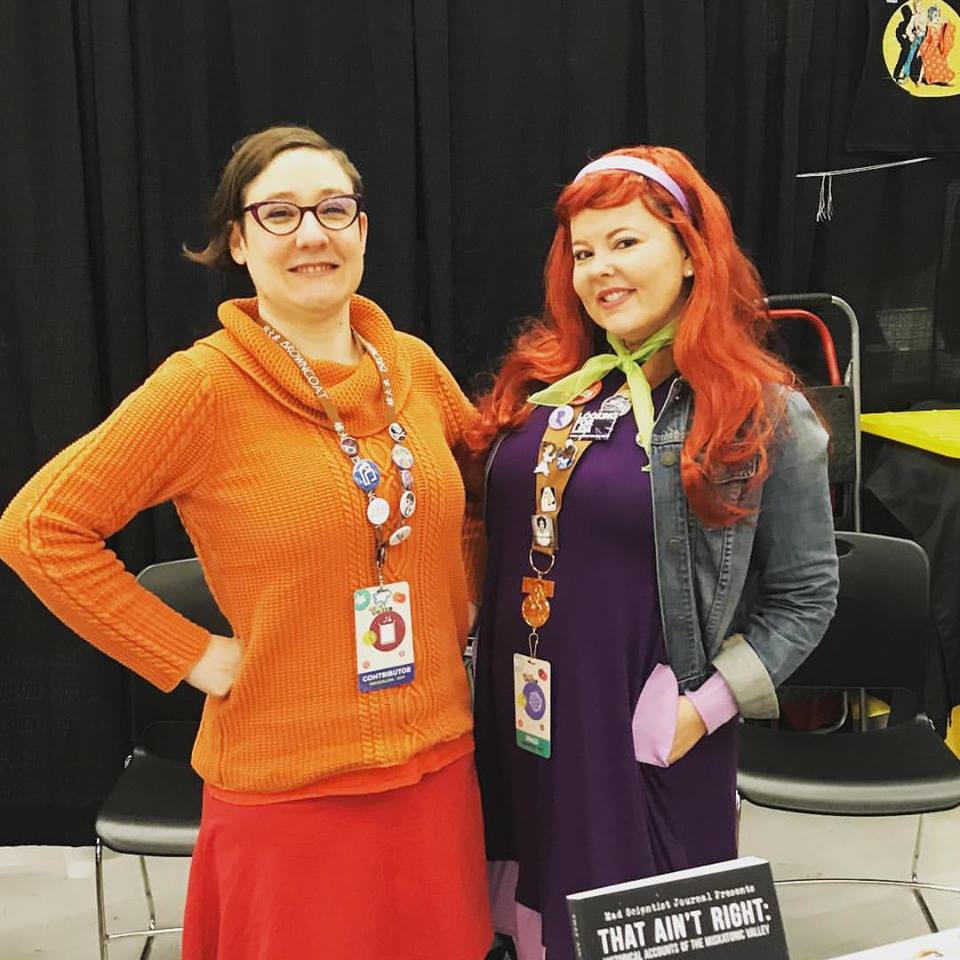

Dawn Vogel and Amanda Cherry cosplaying it up for our table at GeekGirlCon 2017.
September got back into being zany. We had two conventions we attended and shipped out two books. We learned some lessons along the way.
The Money Aspect
Amounts in parentheses are losses/expenses.
Hosting: (-$17.06)
Stories: (-$45.00)
Art: (-$187.63)
Advertising: (-$115.34)
Processing Fees: (-$7.21)
Printing: (-$2,457.15)
Conventions: (-$45.00)
Donations: $68.66
Ad Revenue: $0.12
Physical Sales: $27.00
Online Book Sales: $149.95
Total: (-$2,628.66)
QTD: (-$5,056.43)
YTD: (-$5,593.73)
All Time: (-$25,613.96)
As usual, I try to list costs for art and stories under the month that the stories run on the site rather than when I pay them. (This does not apply to special content for quarterlies, which does not have a specific month associated with it.) Sales are for sales when they take place, not when they’re actually paid out to me. Online book sales reflect the royalties given after the retailer takes their cut. Physical book sales represent gross income, not counting the cost of the physical book. Donations include Patreon as well as other money sent to us outside of standard sales.
This month’s main expense was printing books. Mostly for both Utter Fabrication and Autumn 2017. But we knew we would be attending GeekGirlCon at the end of the month, which we knew would be a bigger convention than we’ve ever been to, so we bought a TON of books for that as well. GeekGirlCon turned out to be our most financially successful conventions to date. The convention straddled two months (the last day of September and the first day of October), so I’ll be including those sales in next month’s report. (I could have split it out by day, but I didn’t.) Spoiler: It was $379 for just MSJ related books, $500+ for all of our books.
We also attended Renton City Comic Con, which was a great convention but probably not the best market for us. Dawn’s hand-crafted items sold well, but very few people seemed interested in buying books. If we attend again next year, we probably won’t be doing so as DefCon One Publishing.
Submissions
In September, we were open to general submissions. We received 88 submissions and accepted 25 (28%). This puts our all time acceptance rate at 38.1%.
Followers
At the end of September, we had:
Patreon: 15 (-1)
Facebook: 1,701 (+32)
Twitter: 563 (+15)
Tumblr: 237 (+4)
Mailing List: 76 (+0)
Google+: 63 (+0)
Traffic
Last Three Months:
September 2017: 1,666 visits, 1,266 users, 2,841 page views, peak day of 135
August 2017: 965 visits, 762 users, 1,581 page views, peak day of 47 visits.
July 2017: 1,216 visits, 914 users, 2,210 page views, peak day of 120 visits.
Last three Septembers:
September 2016: 999 visits, 764 users, 1,848 pages views, peak day of 67 visits
September 2015: 1,020 visits, 708 users, 2,471 page views, peak day of 88 visits
September 2014: 1,343 visits, 816 users, 2,748 page views, peak day of 79 visits
Those seems like both an improvement over the last few months as well as this time in previous years. Being open to submissions probably helped a good deal. 20% of our page views were for the submissions page alone. But we also got good traffic on our weird science posts, which was gratifying.
Stay tuned for next month! We might actually break even.
Follow us online: