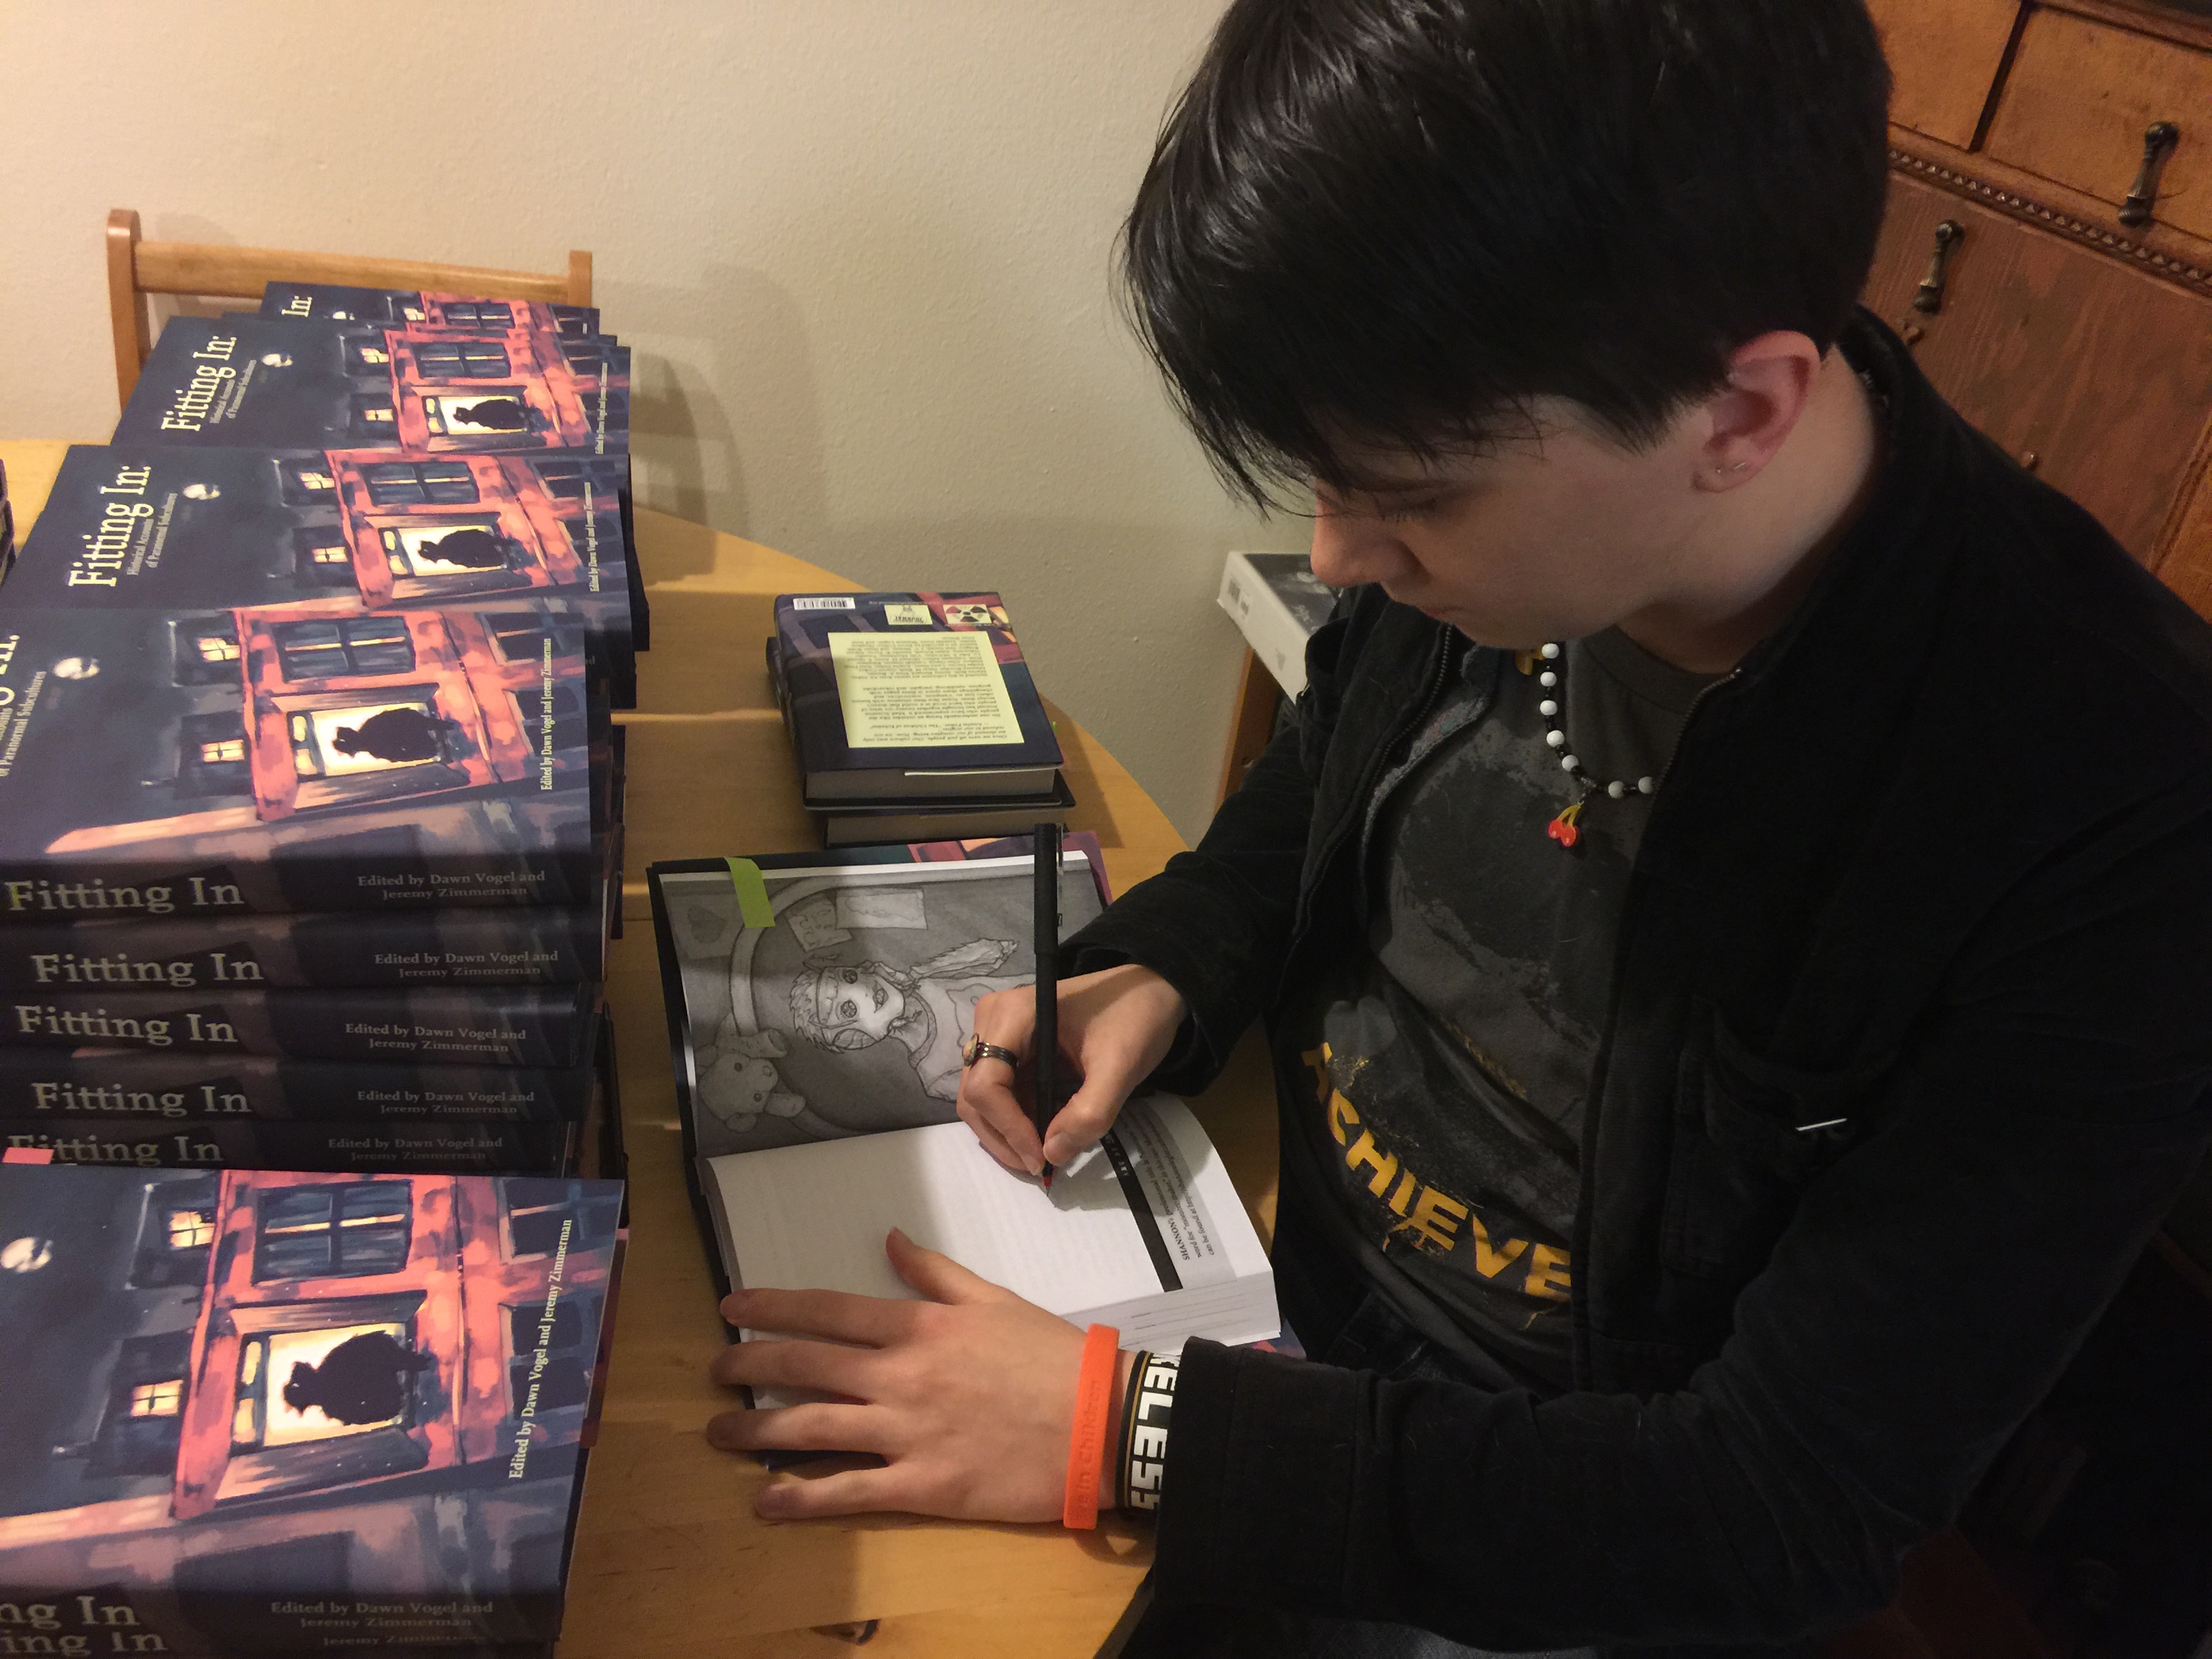
November was about getting books signed by authors and artists and putting together the Winter 2017 quarterly.
The Money Aspect
Amounts in parentheses are losses/expenses.
Hosting: ($17.06)
Stories: ($60.00)
Art: ($417.60)
Advertising: ($30.00)
Processing Fees: ($19.00)
Printing: ($88.23)
Donations: $44.32
Ad Revenue: $0.44
Online Book Sales: $83.67
Total: ($503.46)
QTD: ($2,477.82)
YTD: ($4,543.51)
All Time: ($18,687.55)
As usual, I try to list costs for art and stories under the month that the stories run on the site rather than when I pay them. (This does not apply to special content, which does not have a specific month associated with it.) Sales are for sales when they take place, not when it’s actually paid out to me.
The big charge that doesn’t appear yet is shipping for Fitting In. Our plan is to tally it up when it’s all done. So that will be in next month’s report.
Submissions
We were closed to submissions in November. All time acceptance rate remains at 44.7%.
Followers
At the end of November:
Facebook: 1,407 (+9)
Twitter: 490 (-1)
Google+: 61 (+0)
Tumblr: 191 (+7)
Mailing List: 65 (+1)
Patreon: 11 (+0)
Traffic
This month I learned all about referral spam. Initially Google Analytics said we’d had 2,053 visits, involving 1,381 users and 3,987 page views. This includes an anomalous spike on 11/29 and 11/30 of about 400 visits each day. Turns out that those hits were mainly bogus. After a bunch of research, I figured out how to filter those out. Instead our numbers become 949 visits with 701 users and 1,475 page views. It also makes previous months where we thought we had a lot of hits look less impressive.
Follow us online:
